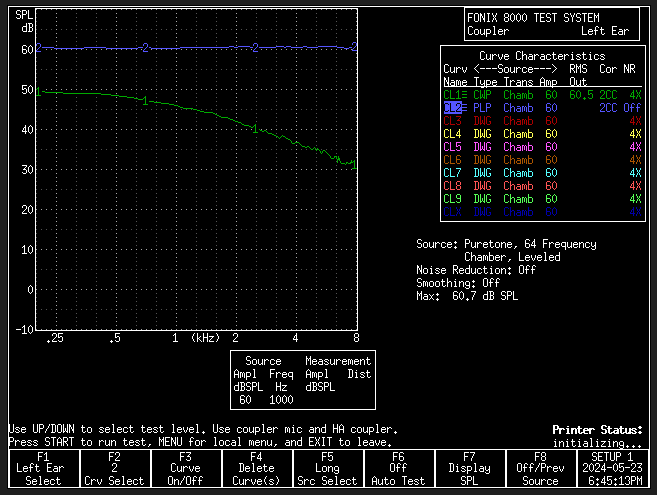
Here is a screenshot from the Fonix 8000 frequency response mode while generating 60 dBSPL composite and Tone long sweeps. Green line (1) is the composite curve and blue line (2) is the tone sweep. This is freq-dBSPL graph showing the dBSPL level of each frequency in the sound currently being generated inside the fonix soundproof chamber. “Tone sweep” is a sweep of pure tone frequencies from low (~200 Hz) upto 8000 Hz each at 60 dBSPL, and curve 2 shows the dBSPL measured by the fonix microphone when each tone is playing. There is nothing else in the chamber and the measurement microphone is at the reference point. This is basically showing the intensity level of sound generated by the fonix speaker.
I understand what tone long sweeps are and what the graph is showing me, but I cannot understand at an intuitive level what the composite signal is or what even its point is. I am only doing chamber tests (no real ear measurements) in case this is relevant. If I want to see the frequency response of my hearing aid (see what exactly it outputs at any given frequency), aren’t I always better off using the pure tone sweep? I have noticed that in the freq-Gain view, the hearing aid frequency response curve for pure tone sweep and composite are almost similar (but never equal), but isn’t the tone long version supposed to be the accurate one? How does the curve from composite signal even manage to come close to the tone long version?
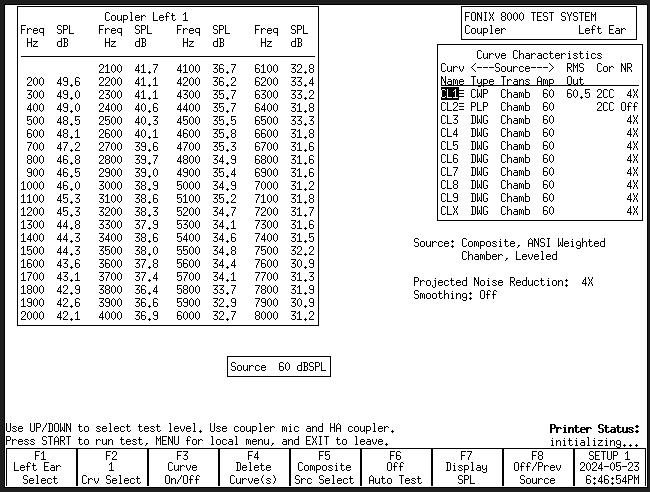
I think it would help me better understand what’s going on if I could find out how they are calculating the 60.5 dB RMS out (shown in the box at the right). Could someone please explain how this value can be calculated for the composite curve? Here are the data points for the curve 1 above
yes thats what I would do when measuring frequency response of hearing aid
but I am trying to figure out what the composite signal itself is first
And particularly how does that “RMS Out” value equal 60.5 dB
For the screenshots above the mic is at the fonix’s reference point, so it is measuring the raw dbSPL level generated by fonix speaker
It’s explained on page 37 and 38 of the user manual.
The machine uses either ICRA or ANSI filters to emulate the ear/hearing vs straight dB SPL, so you can you can get a realistic result with a 2CC coupler.
what does “realistic result” mean? Isn’t tone sweep supposed to show the actual gain the hearing aid is applying at particular frequencies? And it doesn’t explain how I would get the RMS out value show in the screenshot above
The gain in pascals of pressure per mm2, or the gain as ‘you’ would hear it. All SPL scales are fudged to either take account of the human perceived loudness or the measuring device, or the processing device or all three.
Although you seem a bit hung up on all this (you might want to do a bit of research around the various dB scales and perception, plus the various models of couplers, Zwislocki, 0.707 and 2CC and how earlier analogue aids worked with swept note delivery); very little of it actually passes over to the practical side.
If I may ask: what are you actually trying to do? If you’re trying to calibrate the mics in a sound-box without a coupler attached then you’ll get this kind of result.
If you’re testing an aid, put it in test mode and run the sweep. Other than that, the sweep test is particularly redundant as the aid recognises a rising pure-tone sound and kills it as likely feedback.
Are you saying the dBSPL value shown by fonix is not the pressure per mm2 at the point where the fonix measurement mic is present (be it inside a coupler or out)? If you are saying this based on the fonix manual I would be grateful if you can point out where its mentioned.
I am not trying to calibrate anything; these screenshots are obtained by placing fonix’s own measurement mic at its designated reference point without anything else in the chamber. As I mentioned in the post I am trying to figure out what the fonix composite signal itself is, and the point of having it. For starters I am trying to figure out how it comes up with RMS out = 60.5 dBSPL, if the dBSPL values of the individual frequencies in the composite signal are as shown in the screenshot above
That’s not necessarily true. If the hearing aid device I am testing does not have feedback cancellation running on it this should not happen.
If you read the manual it shows you the ANSI figure rolls off at about 6DB per octave.
You don’t seem to understand how SPL differs under different application applications and measures. The ANSI scale starts lower and rolls off into the HF. You can Google the different implementations if you want better definitions.
Sorry, your failure to understand the explanation or the underlying theory isn’t a reason that it’s invalid.
Either Google it, have a look at the development of the different standards, the development of different couplers or the attempts to emulate how the ear actually hears vs reference level testing. I suggest you look at some of the Frye or Knowles Tech bulletins too. ICRA and ANSI standards exist to replicate this effect.
Also, the only place you’d typically use a swept tone is calibration or mic manufacture. It’s not just the feedback manager in aids that makes the amplification inconsistent.
Apology accepted, and I apologise if it came across as a bit brash, but I didn’t say the explanations were invalid. If someone made a good faith effort to post a question (clearly because there is a lack of understanding at some level, otherwise they wouldn’t bother to post the question here), just saying search google for a better explanation isn’t helping anyone. I already know there aren’t many people who can explain this topic in a clear understandable way. But whatever small number of people there are who can, this question is a shot in the dark to find them.
The company is still around but I believe they have scaled down their production some what. From what I understand they are still manufacturing replacement parts for their measuring instruments.